
The need to know the status of your IT infrastructure has always been a necessity. The large number of monitoring solutions available today in the market proves this necessity
The Checkmk monitoring system is delivered in a bundle called OMD (Open Monitoring Distribution) and is available for download as an installation kit for the most common Linux distributions. Those who would like to test the latest changes can choose the from a daily or master build. The downloads are available via the checkmk.com download page.
Choose your edition
CRE – the Raw Edition (completely open source)
CEE – the Enterprise Edition CME – the Managed Service Edition (for managed service providers)
Checkmk Appliance - The Enterprise or Raw edition of Checkmk delivered as a virtual appliance
You will also find links to the Free version including a free edition of the appliance.
Today we are presenting the installation process of Checkmk Enterprise Edition and the first steps required to utilise the monitoring solution. The installation will be made on a CentOS 8 system. To be able to install Check_MK, first it is necessary to enable the EPEL repository, and this can be done by running:
# yum -y install epel-release
The epel repository enables access to required third-party packages. Once epel has been enabled we continue to install Checkmk by placing the download package somewhere on your server.
# yum install /tmp/check-mk-enterprise-2.0.0p15-el8-38.x86_64.rpm
At the end of the installation we are ready to run the first site. Checkmk provides an omd command which allows the management of sites. In future articles we will go into more details about all the components of the monitoring solution and detail what can be done with multiple sites. In this case we will create and run a single site that we will call “firstsite”.
# omd create firstsite
After the site is created, we are announced that it can now be run by using the command “omd start firstsite”. We are also presented with the link to access the web interface, and the username and password needed for administration. In order to manage the site from a command line we would need to run 'omd su firstsite'. We can now start the site by using the command:
# omd start firstsite
Now if the firewall permits connections on port 80, we are ready to connect to our monitoring platform by using one of the following addresses: https://hostname/firstsite or http://IP Address/firstsite.
Next we will be presented a login page where we will use the username cmkadmin and the password that was written on the screen at the end of the installation step.
After logging in we will click on Setup – the web administration tool for Checkmk – and in the Users section, we`ll use the User button. From the resulting page select Add User from the main menu.
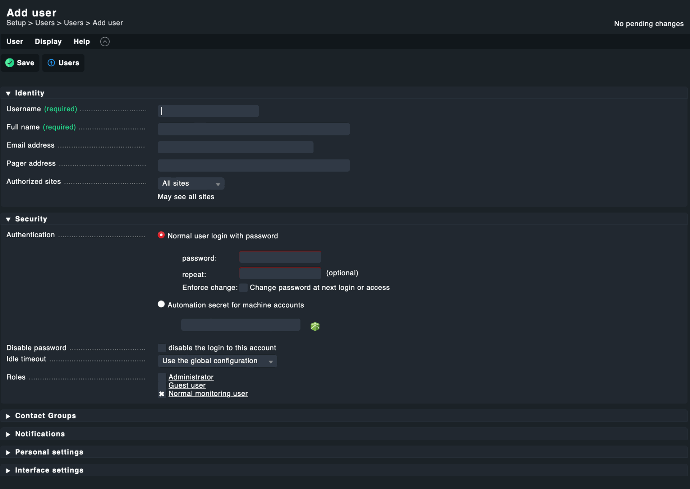
As can be seen in the image above, we can set the username, password, email address (where future notifications will be sent to), roles, the association with any contact groups and change personal settings that are related to language, start page etc. Roles & Permissions and Contact groups allocation can be defined/modified by accessing the corresponding section within the Setup main menu.
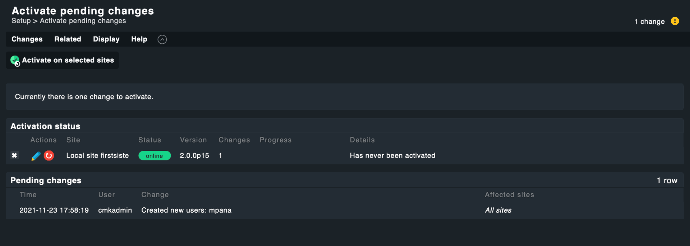
While configuring Checkmk you will notice that after each save there will be an orange badge in the top right corner that indicates the number of changes that are still inactive. By clicking this button, we will get access to the activation menu, as shown in the image bellow.
Now that we have another user with administrative rights we can change the password of cmkadmin user from the same Setup -> Users page.
We generally recommend changing the cmkadmin user password after the first login and using this account only in case of emergencies. Using named accounts offers more traceability.
The next step is to add the system that you would like to monitor and in order to do this we will have to install the unique Checkmk agent on the target host. In our case, we will download the agent for CentOS because we want to monitor the server which is running the Checkmk server. This agent can be accessed at the following link: http://IP_server/firstsite/check_mk/agents/ or from Setup -> Agents -> Windows, Linux, Solaris, AIX section.From any of those locations you can download agents for multiple platforms and a rich collection of plug-ins. In our case, after downloading the agent from the Agent Bakery (Setup -> Agents section) we will execute the installation by running:
# yum install tmpcheck-mk-agent-2.0.0p15-edbddb7d6a5eb9e6.noarch.rpm

Ater the installation, the agent will be listening on port 6556 via xinetd or systemd (Checkmk will identify which mechanism to use automatically). The connection on this port from the monitoring server must be allowed (check your firewalls). With the agent installed, we can now choose the first element that we want to monitor. This can be done from Setup section by accessing Hosts->Hosts link. From the resulting page click on Add Host in the main menu.
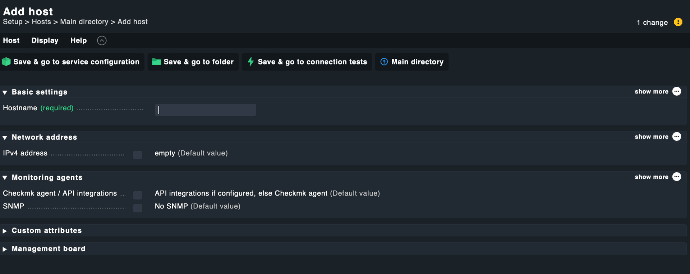
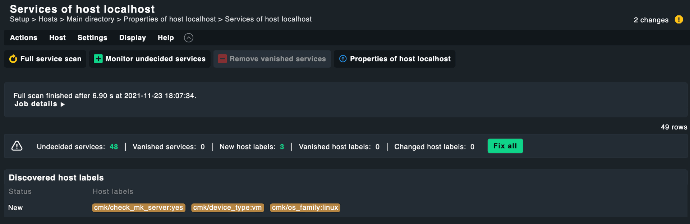
You will need to complete the Hostname and possibly the IP Address if the hostname is not resolvable via DNS. Click on Save & go to services, to initiate a Service Discovery.
By clicking on Fix all you will add all discovered services and labels to the monitoring. The number of services can be extended by updating the agent with different plug-ins, by using active checks or by fine-tuning using the Rule Based Configuration (this will be covered in a future article).
The modification will be activated the same way it was done after the creation of a new user, by activating changes.
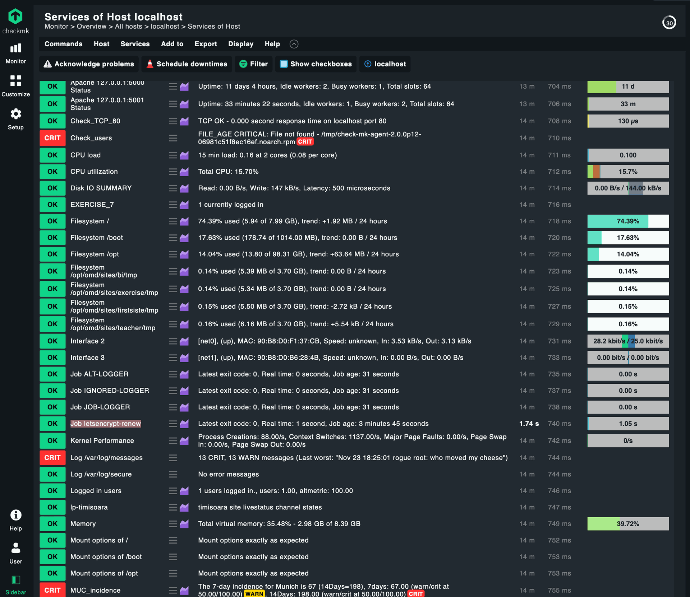
We can now view our newly monitored host by navigating to Monitor, Overview and selecting the All hosts view.
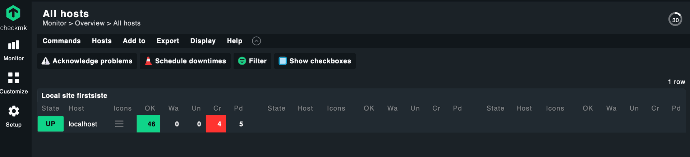
As shown in the image from above we have 46 services in OK state, 4 in CRITICAL and 5 in PENDING on our newly created host. By clicking the name of the host we can access the page that shows in detail the monitored services..
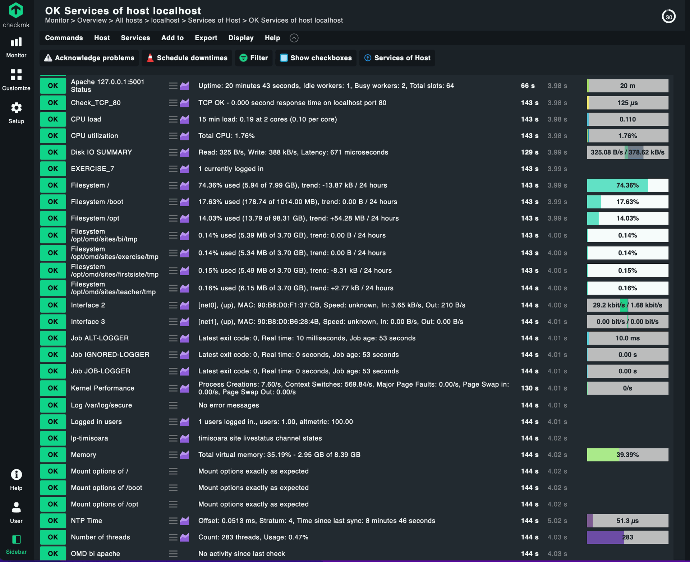
Besides looking at the details of the monitored services, their metrics and performance, on this page we can also make use of the refresh button – to instantly run a check, to view/update the threshold for sending notifications or to show the performance graphs of a specific service/metric. All this can be done from the actions menu (hamburger menu) or the little graph icon.
At this point we have a functional Checkmk site, a dedicated user, a monitored host on which we installed the Checkmk agent.
Before closing we would like to show you how with minimal effort we can monitor cron jobs (unix/linux scheduled tasks), in this case the renewal of a Lets Encrypt Certificate certificate:
# crontab -l
* 23 */2 * * mk-job letsencrypt-renew certbot renew
The important bit here is the "mk-job" that prefixes the command. mk-job is a wrapper developed by Tribe29 (makers of Checkmk) that will execute your cron for you and then monitor its execution gathering performance metrics as well as the overall status. The mk-job tool is shipped with the Checkmk agent package we downloaded earlier.
The job must run at least once before Check_MK can identify this service. Once it has run at leasrt once, we can return to the Setup -> Hosts section and perform a full service scan on our existing host to discover new services.
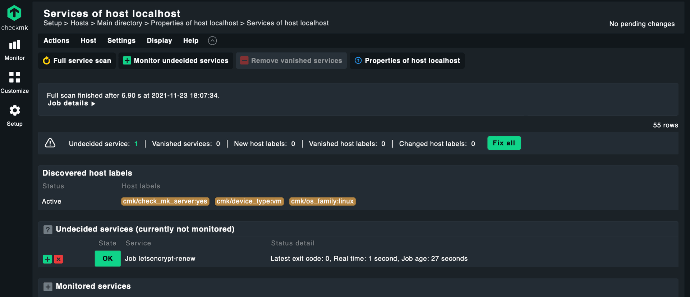
Checkmk has identified new service called: “Job letsencrypt-renew”. We can add this service to the list of monitored services either by clicking on the green button to the left or by clicking “Fix all” . If the job is not yet present in the list, we can execute a full scan of the host by clicking the Full service scan button.
After activating changes and going back to our Host services view we can now see the execution of our scheduled jobs. The cool part is we get performance metrics alongside fault monitoring of our job (we will be alerted if it fails).
We hope that this introduction of the Checkmk monitoring system convinced you to give it a test drive. It is a monitoring system that is renowned for its power, flexibility and ease of use.
Contact us or book a live demo with one of our Checkmk consultants.